
Earlier this summer Kevin Cheveldayoff extended the young 27 year old with a six year contract for 33.6 million dollars. The contract placed Blake Wheeler as the highest cap hit for all of the Winnipeg Jets forwards and second only to Tobias Enstrom for the entire team. At the time, Wheeler had amassed 93 goals, 139 assists and 232 points in 372 games. So far this season, Wheeler is fourth in team points and assists and one single goal shy from being tied for second in goals.
So, what's the deal?
Well, he is 78th in the league for points, which would place him as a very low end first line player, and you have to go all the way to 107th to find Wheeler for goals. In addition, the team has been slowly playing themselves out of any chance for a playoff spot with the Central Division strongly out pacing the Jets.
Are these people justified in their opinion of Wheeler? Let's break down Wheeler's numbers and see if they can suggest some changes.
Scoring
As noted earlier, Wheeler is still near the top for points on the Jets. But, is he scoring well compared to his norm?
Fig1. 2013-14 Blake Wheeler 5v5 production versus Career
| Year | G/60 | A/60 | P/60 |
| 2013-14 | 0.467 | 1.245 | 1.712 |
| Career | 0.874 | 1.170 | 2.044 |
* Numbers are from hockeyanalysis.com instead of behindthenet.com to remove empty-net goals
Immediately we can see something is different. While Wheeler's assist production is similar to what we normally see in his career, his goal scoring is significantly lower. It should be noted that Wheeler's career 2.044 5v5 points per 60 minutes is the highest of any active Jets players, with Ladd at 2.035 and Kane at 1.938.
Well, how is he doing compared to the rest of the Jets in goal scoring?
Fig2. Jets forwards goal scoring production
| Name | All Shots | 5v5 Shots/60 | 5v5 G/60 | 5v5 Sh% | 5v5 iCorsi/60 | 5v5 IGP | 5v5 ShDist |
| Evander Kane | 108 | 12.03 | 0.752 | 6.25 | 22.114 | 35.7 | 34.0 |
| Blake Wheeler | 86 | 9.96 | 0.467 | 4.69 | 15.723 | 18.7 | 29.8 |
| Michael Frolik | 62 | 9.35 | 1.168 | 11.68 | 16.354 | 50.0 | 32.3 |
| Andrew Ladd | 73 | 8.04 | 0.804 | 10.00 | 14.470 | 29.4 | 27.3 |
| Bryan Little | 66 | 7.86 | 1.079 | 13.73 | 10.791 | 35.0 | 27.7 |
| Devin Setoguchi | 57 | 7.57 | 0.668 | 9.09 | 12.555 | 28.6 | 30.9 |
| Eric Tangradi | 27 | 7.54 | 0.279 | 3.70 | 12.007 | 20.0 | 26.6 |
| Matt Halischuk | 30 | 6.54 | 0.503 | 7.69 | 10.565 | 20.0 | 34.7 |
| Olli Jokinen | 54 | 6.45 | 0.630 | 9.76 | 11.333 | 30.8 | 29.9 |
| Mark Scheifele | 38 | 5.45 | 0.170 | 3.12 | 9.459 | 8.3 | 27.2 |
| James Wright | 20 | 4.68 | 0.000 | 0.00 | 6.246 | 0.0 | 29.9 |
| Chris Thorburn | 5 | 2.13 | 0.000 | 0.00 | 5.324 | 0.0 | 31.7 |
| Average | 51 | 7.30 | 0.543 | 6.64 | 12.445 | 23.0 | 30.2 |
* Numbers are from hockeyanalysis.com instead of behindthenet.com to remove empty-net goals
* iCorsi/60 is personal shot attempts per 60 minutes; IGP is percentage of Jets goals while the player is on the ice is scored by the player
Interestingly enough, only Eric Tangradi, Mark Scheifele, James Wright, and Chris Thorburn have scored less 5v5 goals per minute than Blake Wheeler. But unlike those forwards –with the exception of Eric Tangradi–, Blake Wheeler actually shoots the puck enough to be a scorer. Wheeler is second only to Evander Kane in shots on goal for both total and per minute, and Wheeler takes more shooting attempts per icetime than anyone other than Evander Kane and Michael Frolik.
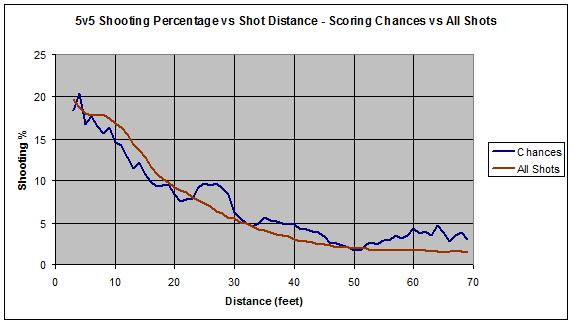
Wheeler's shot locations also occur closer to the net than the average Jet. Distance to the net is fairly predictive of the reasonable shooting percentage one should expect. It is really interesting in comparing Blake Wheeler to Michael Frolik, a Jet winger shooting similar amounts but who has enjoyed a higher shooting percentage.
Perhaps Frolik is just creating more scoring chances?
Fig3. Blake Wheeler versus Michael Frolik for shooting distribution

* the Sporting Charts data is a few games behind and showing all strengths
Wheeler's shot distribution looks pretty decent beside Frolik's. The difference really has been how many go in the net, a variable of factors predominately outside of the individual's control.
So, is this shooting percentage the norm for Wheeler or an outlier that we should expect to regress to the mean in time?
Fig4. Blake Wheeler’s NHL career scoring production
| Season | Shots/60 | G/60 | Sh% | iCorsi/60 | On-Ice CorsiFor/20 | On-Ice Sh% |
| 2013-14 | 9.963 | 0.482 | 4.69 | 15.427 | 19.551 | 7.48 |
| 2012-13 | 8.337 | 1.084 | 13.00 | 15.007 | 20.454 | 9.49 |
| 2011-12 | 8.431 | 0.536 | 6.36 | 14.524 | 21.347 | 8.59 |
| 2010-11 | 8.931 | 1.030 | 11.54 | 14.026 | 20.801 | 7.60 |
| 2009-10 | 7.258 | 0.861 | 11.86 | 13.470 | 19.416 | 7.94 |
| 2008-09 | 8.545 | 1.001 | 11.72 | 12.884 | 19.627 | 11.53 |
| Average | 8.578 | 0.8323 | 9.89 | 14.223 | 20.199 | 8.77 |
* Numbers are from hockeyanalysis.com instead of behindthenet.com to remove empty-net goals
* On-Ice CorsiFor/20 is shot attempts by team while player is on the ice; On-Ice Sh% is the team's shooting percentage while player is on the ice
Anyone else see a pattern with the years fans were harsh on Wheeler and his personal shooting percentage? In 2011-12 and 2013-14 Wheeler has had uncharacteristically low shooting percentages. As history has shown, extreme peaks and valleys for On-Ice Sh% and personal Sh% tend to be more of an indicator of luck rather than an actual repeatable evaluation of skill or effort. History has also shown that personal and on-ice shooting percentages strongly manipulate management, media and fans opinions, when they shouldn't. Both Wheeler's personal and on-ice shooting percentages have been at a career low and will likely return in time.
Essentially, Wheeler's output is not characteristic of his input and a players input is what you should judge them on.
Another interesting discovery is that Wheeler has been steadily, nearly linearly, increasing his individual shot attempts per icetime. This is a good indication that Wheeler has been increasing the amount of scoring chances he creates, more so than his actual goal scoring rate.
Fig5. Blake Wheeler's personal shot attempts and line's shot attempts with Wheeler's goal scoring rate

*there is an error in the legend where it should be "iC/60" and "CF/20"… also, numbers are from hockeyanalysis.com instead of behindthenet.com to remove empty-net goals
This graph illustrates how much strength variance has over an individual's shooting percentages. With large sample sizes like this, Corsi can be taken as a proxy for scoring chances. Over the last three seasons, Wheeler has seen a negative trend with less scoring chances occurring while he is on the ice (CF/20). Some of this has to do with Noel splitting Wheeler from Ladd and Little for spurts, but the larger factor is LLW has seen tougher assignments in zone starts and competition levels as a whole. Despite this trend, Wheeler has actually steadily increased the amount of scoring chances he is producing himself (iC/60).
Shot Metrics and Two-Way Play
Offensive production is only one part of the game. After all, the game is about scoring more than your opponent. Everything else is just details.
Shot metrics using shot attempts (ie: Corsi) or non-blocked shot attempts (ie: Fenwick) are predictive of future goal differentials more so than past goal differentials. While Wheeler's raw shot metrics appear to be right in between those of the previous two seasons, these numbers could be affected by score effects and zone starts.
Fig6. Blake Wheeler's Zone-Start Adjusted in Close Situations 2013-14 non-blocked shot attempts
| Year | TOI | FF/20 | FA/20 | FF% |
| 2013-14 | 255:09 | 14.266 | 14.501 | 49.6% |
| 2012-13 | 477:38 | 15.577 | 15.367 | 50.3% |
| 2011-12 | 776:57 | 16.114 | 14.209 | 53.1% |
| 2010-11 | 589:02 | 16.332 | 14.702 | 52.6% |
* Numbers are from hockeyanalysis.com
Similar to Wheeler's goalscoring, this seasons numbers seem to have gone down, albeit it not significantly from the previous season. The drop from 2011-12 to 2012-13 arose from a shift in usage, where LLW started seeing less offensive zone starts and tougher match ups.
Speaking of LLW, it is well known that Andrew Ladd and Bryan Little are formidable two-way forwards, who are as strong defensively as they are offensively. Perhaps Blake Wheeler has been riding on his two linemates?
Fig7. Blake Wheeler's Zone-Start Adjusted in Close Situations 2013-14 WOWY
| With Wheeler | Without Wheeler | Wheeler without | ||||
| Player | TOI | CF% | TOI | CF% | TOI | CF% |
| Bryan Little | 136:58 | 51.3 | 78:41 | 50.3 | 80:26 | 46.7 |
| Andrew Ladd | 107:20 | 54.2 | 97:36 | 48.5 | 110:04 | 45.1 |
| Evander Kane | 79:28 | 45.0 | 153:31 | 56.3 | 137:56 | 52.4 |
| Olli Jokinen | 39:12 | 46.7 | 168:53 | 54.4 | 178:12 | 50.3 |
| Mark Scheifele | 33:26 | 50.0 | 169:09 | 44.9 | 183:58 | 49.5 |
* Numbers are from hockeyanalysis.com
For Wheeler's ice time with Little and Ladd, this is not the pattern one would see where the others are carrying a player. While Wheeler improves during his time with his two most common linemates, they also improve when with him. This is the pattern you see with strong chemistry between good players.
Wheeler having great chemistry with Little and Ladd shouldn't be surprising. The three have played together for a long time and often as a whole they are greater together than the mere sum of the parts. They each bring characteristics that highlights the others' strengths.
Their successful results this season is not uncharacteristic of their history with each other.
Fig8. Blake Wheeler's Zone-Start Adjusted in Close Situations WOWY with Bryan Little and Andrew Ladd
| 2011-13 | 2013-14 | |||
| TOI | CF% | TOI | CF% | |
| Bryan Little | 759:29 | 52.3 | 136:58 | 51.3 |
| Andrew Ladd | 643:48 | 53.4 | 107:20 | 54.2 |
* Numbers are from hockeyanalysis.com
All appearances are that the LLW line has performed similar to historical expectations. A greater blame could be placed on Wheeler's shot metrics falling in that he spends the most time away from the LLW line than the other two do. In fact, Wheeler has almost spent equal time with Kane as he has with Ladd.
Summary
Blake Wheeler's goal scoring has dropped from previous seasons; however, his scoring chance creation has actually increased. His shot metrics have fallen from previous seasons, but his metrics with Little and Ladd are similar to historical levels and Wheeler improves Little and Ladd near equally as they improve him.
Be calm, carry on, and realize that the only difference to previous seasons as far as results go are: Wheeler has been moved away more from where he does best and his shooting percentage has been unlucky.
The Jets have larger fish to fry than the shooting percentage of just one forward… besides, results > looks and style.

