
As of this writing, the Jets sport a decent 20-16-5 record through 41 games, good enough for 45 points and a shot at the playoffs. This is actually roughly in line with the “Reasonable Expectations” poll we took in late June, where over 60% of the voters expected the Jets to finish 16th to 25th in the league, with 31% selecting 16th to 20th. With half the season behind us, this is a good time as any to revisit some of the analysis I explored in November, along with a few other measures to see how we’ve done. Are we a 90-point team? Which players have been a big (or small) part of our success?
First of all, a quick superficial projection of player stats, made easy by the fact that we're at exactly halfway through the season:
| Player | GP | G | A | Pts | PIM | PPP | SHP | SOG | ShP |
| Blake Wheeler | 82 | 16 | 46 | 62 | 44 | 16 | 0 | 186 | 8.6 |
| Evander Kane | 80 | 36 | 26 | 62 | 62 | 10 | 0 | 310 | 11.6 |
| Dustin Byfuglien | 70 | 12 | 36 | 48 | 92 | 18 | 2 | 246 | 4.9 |
| Kyle Wellwood | 82 | 16 | 30 | 46 | 4 | 12 | 0 | 102 | 15.7 |
| Bryan Little | 66 | 22 | 20 | 42 | 20 | 16 | 2 | 150 | 14.7 |
| Nik Antropov | 66 | 10 | 30 | 40 | 48 | 10 | 0 | 104 | 9.6 |
| Andrew Ladd | 82 | 26 | 12 | 38 | 58 | 8 | 0 | 268 | 9.7 |
| Zach Bogosian | 82 | 6 | 28 | 34 | 94 | 8 | 0 | 156 | 3.8 |
| Alexander Burmistrov | 76 | 16 | 18 | 34 | 44 | 4 | 2 | 140 | 11.4 |
| Tim Stapleton | 64 | 12 | 12 | 24 | 4 | 14 | 0 | 70 | 17.1 |
| Tobias Enstrom | 42 | 2 | 22 | 24 | 28 | 16 | 0 | 58 | 3.4 |
| Tanner Glass | 82 | 8 | 16 | 24 | 86 | 0 | 0 | 98 | 8.2 |
| Johnny Oduya | 80 | 4 | 16 | 20 | 44 | 0 | 0 | 68 | 5.9 |
| Jim Slater | 74 | 14 | 4 | 18 | 38 | 0 | 2 | 118 | 11.9 |
| Mark Stuart | 78 | 6 | 8 | 14 | 112 | 0 | 2 | 72 | 8.3 |
| Ron Hainsey | 34 | 0 | 12 | 12 | 12 | 2 | 0 | 34 | 0.0 |
| Mark Flood | 46 | 6 | 6 | 12 | 16 | 4 | 0 | 50 | 12.0 |
| Chris Thorburn | 82 | 0 | 6 | 6 | 96 | 0 | 0 | 72 | 0.0 |
| Antti Miettinen | 18 | 0 | 4 | 4 | 0 | 4 | 0 | 14 | 0.0 |
| Randy Jones | 24 | 2 | 0 | 2 | 8 | 0 | 0 | 20 | 10.0 |
| Eric Fehr | 34 | 0 | 2 | 2 | 12 | 0 | 0 | 42 | 0.0 |
Obviously, some of these guys will be playing more or less in the 2nd half, and some of these numbers will regress. Regardless, it's good to see Kane and Wheeler having quality years so far. It's also awesome to see the kind of year Wellwood's having.
Now to the nitty-gritty…
| Player | GP | Now | 55TOI | Now | SF/60 | Now | SA/60 | Now | OZS% | Now |
| Alexander Burmistrov | 12 | 38 | 13.77 | 13.33 | 24.0 | 26.5 | 22.5 | 24.3 | 60.2 | 54.9 |
| Andrew Ladd | 12 | 40 | 13.49 | 13.65 | 32.2 | 31.3 | 25.9 | 25.1 | 58.2 | 53.6 |
| Blake Wheeler | 12 | 40 | 13.91 | 14.28 | 30.6 | 30.4 | 28.0 | 28.2 | 56.5 | 53.0 |
| Bryan Little | 12 | 32 | 14.20 | 14.17 | 31.3 | 29.2 | 26.8 | 27.3 | 57.9 | 48.5 |
| Chris Thorburn | 12 | 40 | 9.34 | 9.24 | 16.6 | 22.4 | 34.3 | 29.2 | 29.5 | 48.1 |
| Eric Fehr | 16 | 8.67 | 29.0 | 22.5 | 59.3 | |||||
| Evander Kane | 11 | 39 | 12.68 | 14.60 | 30.5 | 30.8 | 20.6 | 25.0 | 71.2 | 56.8 |
| Jason Jaffray | 13 | 6.32 | 35.8 | 24.8 | 43.2 | |||||
| Jim Slater | 10 | 36 | 11.05 | 12.51 | 15.7 | 22.4 | 33.1 | 33.0 | 26.1 | 29.4 |
| Kyle Wellwood | 12 | 40 | 11.87 | 12.81 | 28.2 | 30.7 | 24.0 | 22.5 | 61.5 | 57.7 |
| Nik Antropov | 12 | 32 | 13.07 | 13.17 | 24.1 | 29.9 | 24.5 | 25.6 | 60.0 | 58.4 |
| Tanner Glass | 12 | 40 | 10.27 | 11.49 | 18.0 | 22.5 | 32.1 | 31.5 | 28.3 | 36.2 |
| Tim Stapleton | 8 | 32 | 8.93 | 8.04 | 24.4 | 27.3 | 30.2 | 24.9 | 71.1 | 55.2 |
| Player | G | Now | 55TOI | Now | SF/60 | Now | SA/60 | Now | ZS% | Now |
| Dustin Byfuglien | 12 | 35 | 18.90 | 18.39 | 29.4 | 30.6 | 25.7 | 26.0 | 52.3 | 49.2 |
| Johnny Oduya | 11 | 39 | 14.13 | 15.78 | 19.3 | 28.6 | 31.3 | 27.7 | 51.2 | 46.7 |
| Mark Flood | 1 | 23 | 13.68 | 12.81 | 21.9 | 26.5 | 17.5 | 26.9 | 50.0 | 54.0 |
| Mark Stuart | 11 | 38 | 14.12 | 15.11 | 24.3 | 26.5 | 30.5 | 28.2 | 56.6 | 52.0 |
| Randy Jones | 7 | 11 | 12.95 | 13.99 | 11.9 | 17.5 | 24.5 | 25.0 | 51.2 | 54.1 |
| Ron Hainsey | 4 | 16 | 13.73 | 16.61 | 19.7 | 23.5 | 17.5 | 28.2 | 54.8 | 42.2 |
| Tobias Enstrom | 11 | 20 | 16.75 | 17.35 | 31.3 | 29.1 | 20.5 | 22.8 | 51.5 | 51.0 |
| Zach Bogosian | 12 | 40 | 16.34 | 17.10 | 27.2 | 28.4 | 31.2 | 27.7 | 57.0 | 48.5 |
This is the first set of advanced stats. Each metric has an initial column that was measured in November, and the accompanying column tells us whether the numbers have improved. Be sure to pay attention to things like GP and TOI throughout; small samples make for funky numbers. The Andrew Ladd 55TOI second column is supposed to be green, by the way.
| Player | QoC | Now | PDO | Now | 54TOI | Now | SF/60 | Now | 45TOI | Now | SA/60 | Now |
| Alexander Burmistrov | 3rd | 6th | 1052 | 1009 | 1.91 | 1.60 | 23.5 | 36.6 | 2.44 | 2.21 | 43.0 | 37.8 |
| Andrew Ladd | 10th | 4th | 975 | 966 | 2.83 | 2.39 | 38.9 | 38.9 | 2.42 | 1.97 | 39.3 | 39.6 |
| Blake Wheeler | 13th | 11th | 973 | 1009 | 2.43 | 2.32 | 39.1 | 40.8 | 0.38 | 0.21 | 52.9 | 36.4 |
| Bryan Little | 11th | 5th | 970 | 1018 | 2.76 | 2.70 | 39.8 | 38.9 | 2.41 | 2.04 | 47.8 | 48.6 |
| Chris Thorburn | 8th | 8th | 1003 | 964 | 0.22 | 0.09 | 45.9 | 49.3 | 1.61 | 0.86 | 43.6 | 45.5 |
| Eric Fehr | 9th | 927 | 0.31 | 60.0 | 0.02 | 0.0 | ||||||
| Evander Kane | 5th | 7th | 962 | 1004 | 1.70 | 2.30 | 57.7 | 45.4 | 0.07 | 0.07 | 78.3 | 45.3 |
| Jason Jaffray | 13th | 964 | 0.18 | 25.0 | 0.00 | 0.0 | ||||||
| Jim Slater | 2nd | 2nd | 1066 | 992 | 0.31 | 0.20 | 38.1 | 58.1 | 1.81 | 2.31 | 36.5 | 54.8 |
| Kyle Wellwood | 1st | 1st | 1006 | 973 | 1.62 | 1.95 | 40.1 | 40.0 | 0.20 | 0.09 | 25.0 | 16.1 |
| Nik Antropov | 6th | 10th | 1014 | 994 | 2.01 | 2.05 | 34.8 | 36.5 | 2.09 | 2.28 | 40.6 | 40.3 |
| Tanner Glass | 9th | 3rd | 1063 | 1004 | 0.19 | 0.09 | 80.0 | 82.9 | 0.61 | 1.60 | 57.8 | 59.2 |
| Tim Stapleton | 12th | 12th | 981 | 971 | 0.85 | 1.32 | 70.9 | 38.3 | 0.00 | 0.07 | — | 0.0 |
| Player | QoC | Now | PDO | Now | 54TOI | Now | SF/60 | Now | 45TOI | Now | SA/60 | Now |
| Dustin Byfuglien | 4th | 1st | 957 | 968 | 3.43 | 3.54 | 43.7 | 41.6 | 0.65 | 0.70 | 46.0 | 29.6 |
| Johnny Oduya | 9th | 6th | 1033 | 1001 | 0.51 | 0.32 | 10.7 | 32.7 | 2.43 | 2.49 | 26.9 | 36.2 |
| Mark Flood | 8th | 7th | 1000 | 1008 | 0.00 | 1.18 | — | 53.1 | 0.00 | 1.47 | — | 44.5 |
| Mark Stuart | 3rd | 3rd | 1006 | 976 | 0.08 | 0.06 | 67.9 | 26.9 | 3.78 | 3.17 | 44.8 | 50.5 |
| Randy Jones | 10th | 8th | 1045 | 1032 | 0.00 | 0.04 | — | 0.0 | 1.57 | 1.29 | 54.7 | 58.2 |
| Ron Hainsey | 1st | 5th | 1071 | 1052 | 1.22 | 1.09 | 49.1 | 38.8 | 2.67 | 2.62 | 33.6 | 47.1 |
| Tobias Enstrom | 2nd | 2nd | 977 | 978 | 3.94 | 3.52 | 45.7 | 45.5 | 3.39 | 2.17 | 53.1 | 52.6 |
| Zach Bogosian | 5th | 4th | 993 | 977 | 2.29 | 2.64 | 34.9 | 37.1 | 2.71 | 3.38 | 40.6 | 44.6 |
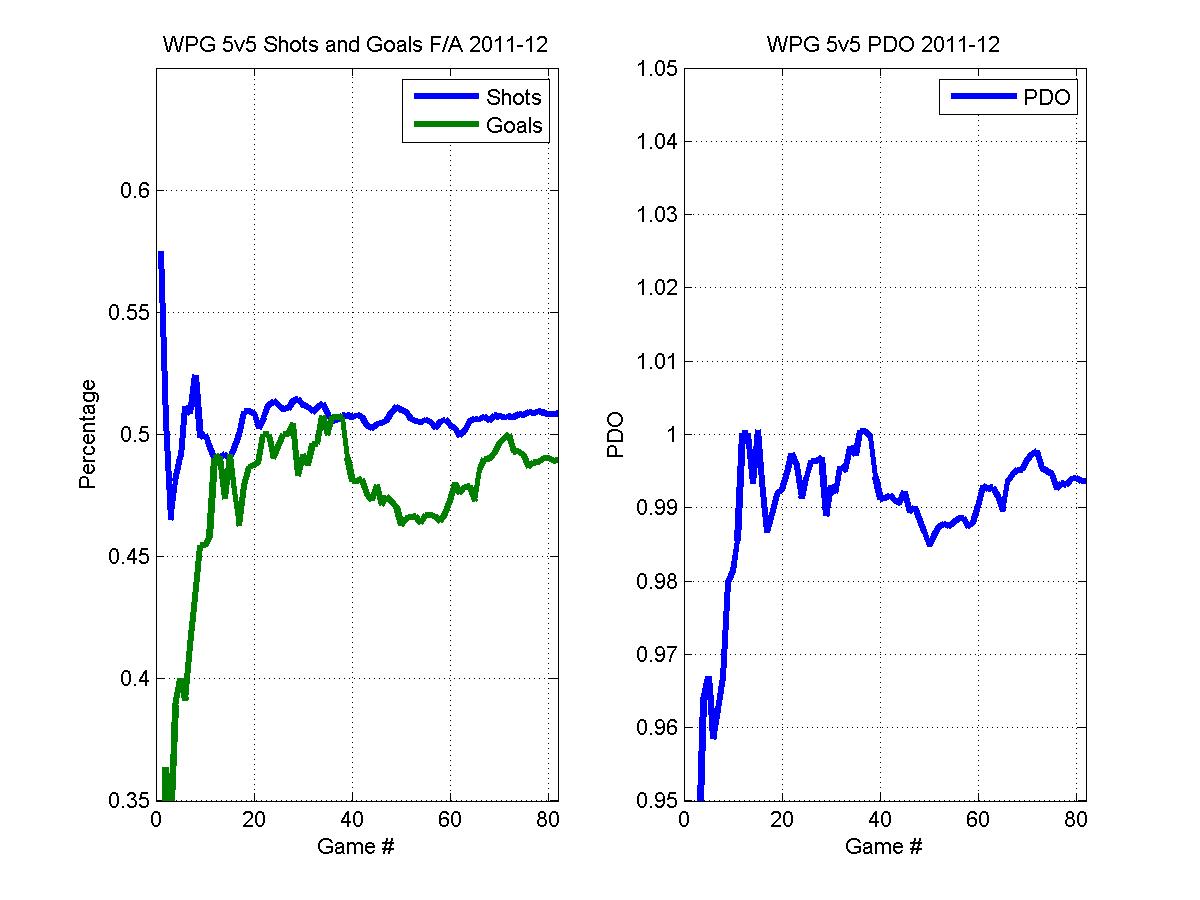
A lot of interesting conclusions we can take from this, including the fact that it appears that Bogosian is truly developing into a quality two-way defenceman (and…shit). A lot of our offence has improved, and it is arguable that the improvement has come at the expense of some defence. The biggest PDO mirages seem to be the "lack" of production of both Ladd and Byfuglien, who could have impressive 2nd halves. The PDOs, in general, seem to allude that we can indeed sustain our success into the 2nd half of the season, a musing further confirmed if you look at our PDO (991) and shot charts from this year (found via Behind the Net):

via behindthenet.ca
| Player | GP | Now | GS | Now | ESSA | Now | ESSV | Now | ESSV% | Now | -Tm | -Lg |
| Chris Mason | 4 | 11 | 2 | 7 | 49 | 170 | 44 | 157 | 0.905 | 0.924 | 0.011 | 0.005 |
| Ondrej Pavelec | 11 | 33 | 11 | 33 | 253 | 765 | 229 | 698 | 0.898 | 0.912 | -0.011 | -0.007 |
Another important factor in our improving record was better goaltending. Pavelec's ESSV% stands to increase even more, and Mason's performance is not altogether unusual for him.
Finally, the Jets' Fenwick Close percentage is good enough for 16th in the league, another confirmation that we are looking at a fringe playoff team. Granted, the bounces might not go our way in the 2nd half, but despite our struggles on the road the Jets have the ability to play some good hockey down the stretch.
| Option | Votes |
|---|---|
| Yes | 23 |
| No | 8 |
