
This is Part 7 in a many part series of answers to frequently asked questions about hockey analysis. Here are Part 1, Part 2, Part 3, Part 4, Part 5 and Part 6.
One of the important contributions that baseball analysts made to the world of sports was to stress the importance of rate statistics and context. When Andre Dawson hit 49 home runs in 1987, the sabermetricians of the day pointed out that Dawson had used 448 outs to get there (a lot) and played his home games at Wrigley Field, which inflated his hitting stats. If you don’t pay attention to how many opportunities a player had and when he got them, you could convince yourself he’s a lot better or worse than he really is (if you ever read Oilers blogger Lowetide, he often talks about a hockey player getting some “at-bats” – the requisite opportunity to make a decision on his performance.)
So when you look at a player's most basic statistics – goals and assists – that you understand how these stats came to be. For example, not to pick on anyone in particular, but Tom Kurvers sticks out in my mind as an offensive defenseman. But Kurvers got 54% of his points on the power-play, even though he spent no more than 20% of his ice time on the PP, and probably less. If we shifted Kurvers from 4 minutes on the power-play to 4 minutes on the penalty-kill, he would have had a completely different career. This is not to say you would do that – not with his offensive skills – but context is a big factor.
We now also know how much ice time every single player gets, which allows us to turn this general understanding of context into rate statistics. Here are the scoring statistics per 60 minutes for forwards and defensemen at 5-on-5 and 5-on-4 last season: (A1 – denotes first assists, A2 – denotes second assists)
| G | A1 | A2 | P | |
| D 5-on-5 | 0.15 | 0.24 | 0.33 | 0.72 |
| F 5-on-5 | 0.76 | 0.63 | 0.41 | 1.80 |
| D 5-on-4 | 0.76 | 1.23 | 1.26 | 3.25 |
| F 5-on-4 | 1.57 | 1.28 | 1.11 | 3.96 |
The first thing that jumps out at you is the huge jump in defense scoring on the power-play. While forwards put up points at a little more than twice the rate they do at 5-on-5, defensemen have a 4.5x increase. This shows up particularly in goals and first assists – defensemen are simply not directly involved in most even-strength offensive play. You could also draw a proverbial "line in the sand" and say that a forward who contributes less than 4 points per 60 minutes on the PP, particularly on the first unit, is not cutting it offensively, even if he gets a lot of ice time and has a high point total as a result.
You can see the overall rate stats for 2008-09 at 5-on-5 here and for 5-on-4 here. At 5-on-5, #2 through #14 don’t surprise me in the least. But Rene Bourque #1 in the league in Pts/60 at 5-on-5? Looking at his raw stats – 40 points in 58 games, it would never occur to me. But Bourque was on Calgary’s third PP unit and never got the chance to rack up gaudy stats with a man-advantage. Similarly, who would have known that Andrew Ebbett had six power-play goals in just 89 minutes on the ice, giving him the highest power-play goal rate in the league?
I think it's instructive to look at what would happen if we had a forward who played 18 minutes a game and was completely average at even-strength, on the power-play and on the PK. If we take him from 15 minutes ES/3 minutes PK to 15 minutes ES/3 minutes PP, we see a completely different player:
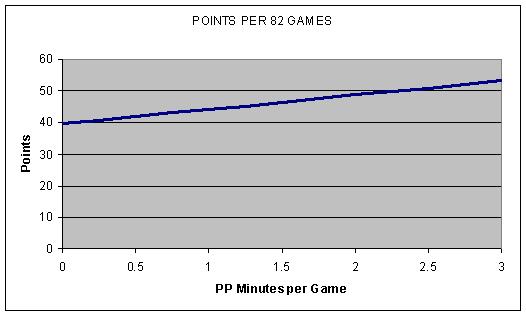
The guy who kills penalties is looking at a 40-point season, while the guy who plays the power-play gets 53 points. Same guy – 34% difference in scoring – all due to context.
